as a follow up–when comparing the price of public transport, a friend duly noted that it would be more interesting to see the relative purchasing power of people in these cities.
conveniently, UBS has published a 2009 report on Prices and Earnings in 73 cities.
using New York as the benchmark, here are the relative purchasing powers (income / price of basket of goods & services) of some cities of note:
| City | Net Hourly Pay | Annual Income |
| New York | 100 | 100 |
| Chicago | 96.3 | 88.8 |
| Berlin | 89.4 | 77.6 |
| Montreal | 88.9 | 83.9 |
| London | 86.7 | 76.9 |
| Toronto | 85.7 | 80.4 |
| Tokyo | 81.4 | 82.2 |
| Paris | 75.2 | 61.3 |
| Taipei | 57.5 | 58.9 |
| Moscow | 55.6 | 49.4 |
| Hong Kong | 52.3 | 58.1 |
| Seoul | 51.3 | 57.4 |
| Kuala Lumpur | 38.4 | 39.5 |
| Shanghai | 25.3 | 24.7 |
| Bangkok | 24.1 | 26.0 |
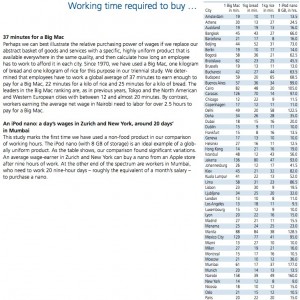
In its report, UBS notes that when comparing purchasing power, the basket of goods and services would be different in Asian cities versus European or North American ones. For that reason, they came up with a measure based on the Economist’s Big Mac Index: working time required to buy a big mac (this is from page 11–download the full report for more info).
It’s funny to use Big Macs as a comparison, since going to McDonald’s in North America (as a cheap place to eat) is not quite the same as in Asia, where it’s more a gimmicky thing (since it would be much cheaper to eat, say, a bowl of noodles). I’m sure McDonald’s considers that when marketing (& pricing?) its menu…


